Today we are going to look back over the years at the tourism in Antigua and Barbuda. Antigua is especially dependent on tourism so it is important that they gather the correct facts and figures. Lets jump in and start to look at the figures! I have to say it's not often I get to write something that will use AI and my own brain to deduct and pull out some trends. It's going to be great- let's go!
The Big Picture
If you don't count UK citizens then Europeans are not visiting Antigua much.
The USA numbers have been growing the most since 2006 in fact the USA overtook the UK in 2007 for the rest of time have been visiting more. The influence of the USA vacationer has had an influence on tipping culture which is not British nor Antiguan, but is coming into effect more and more as the workers of course like it.
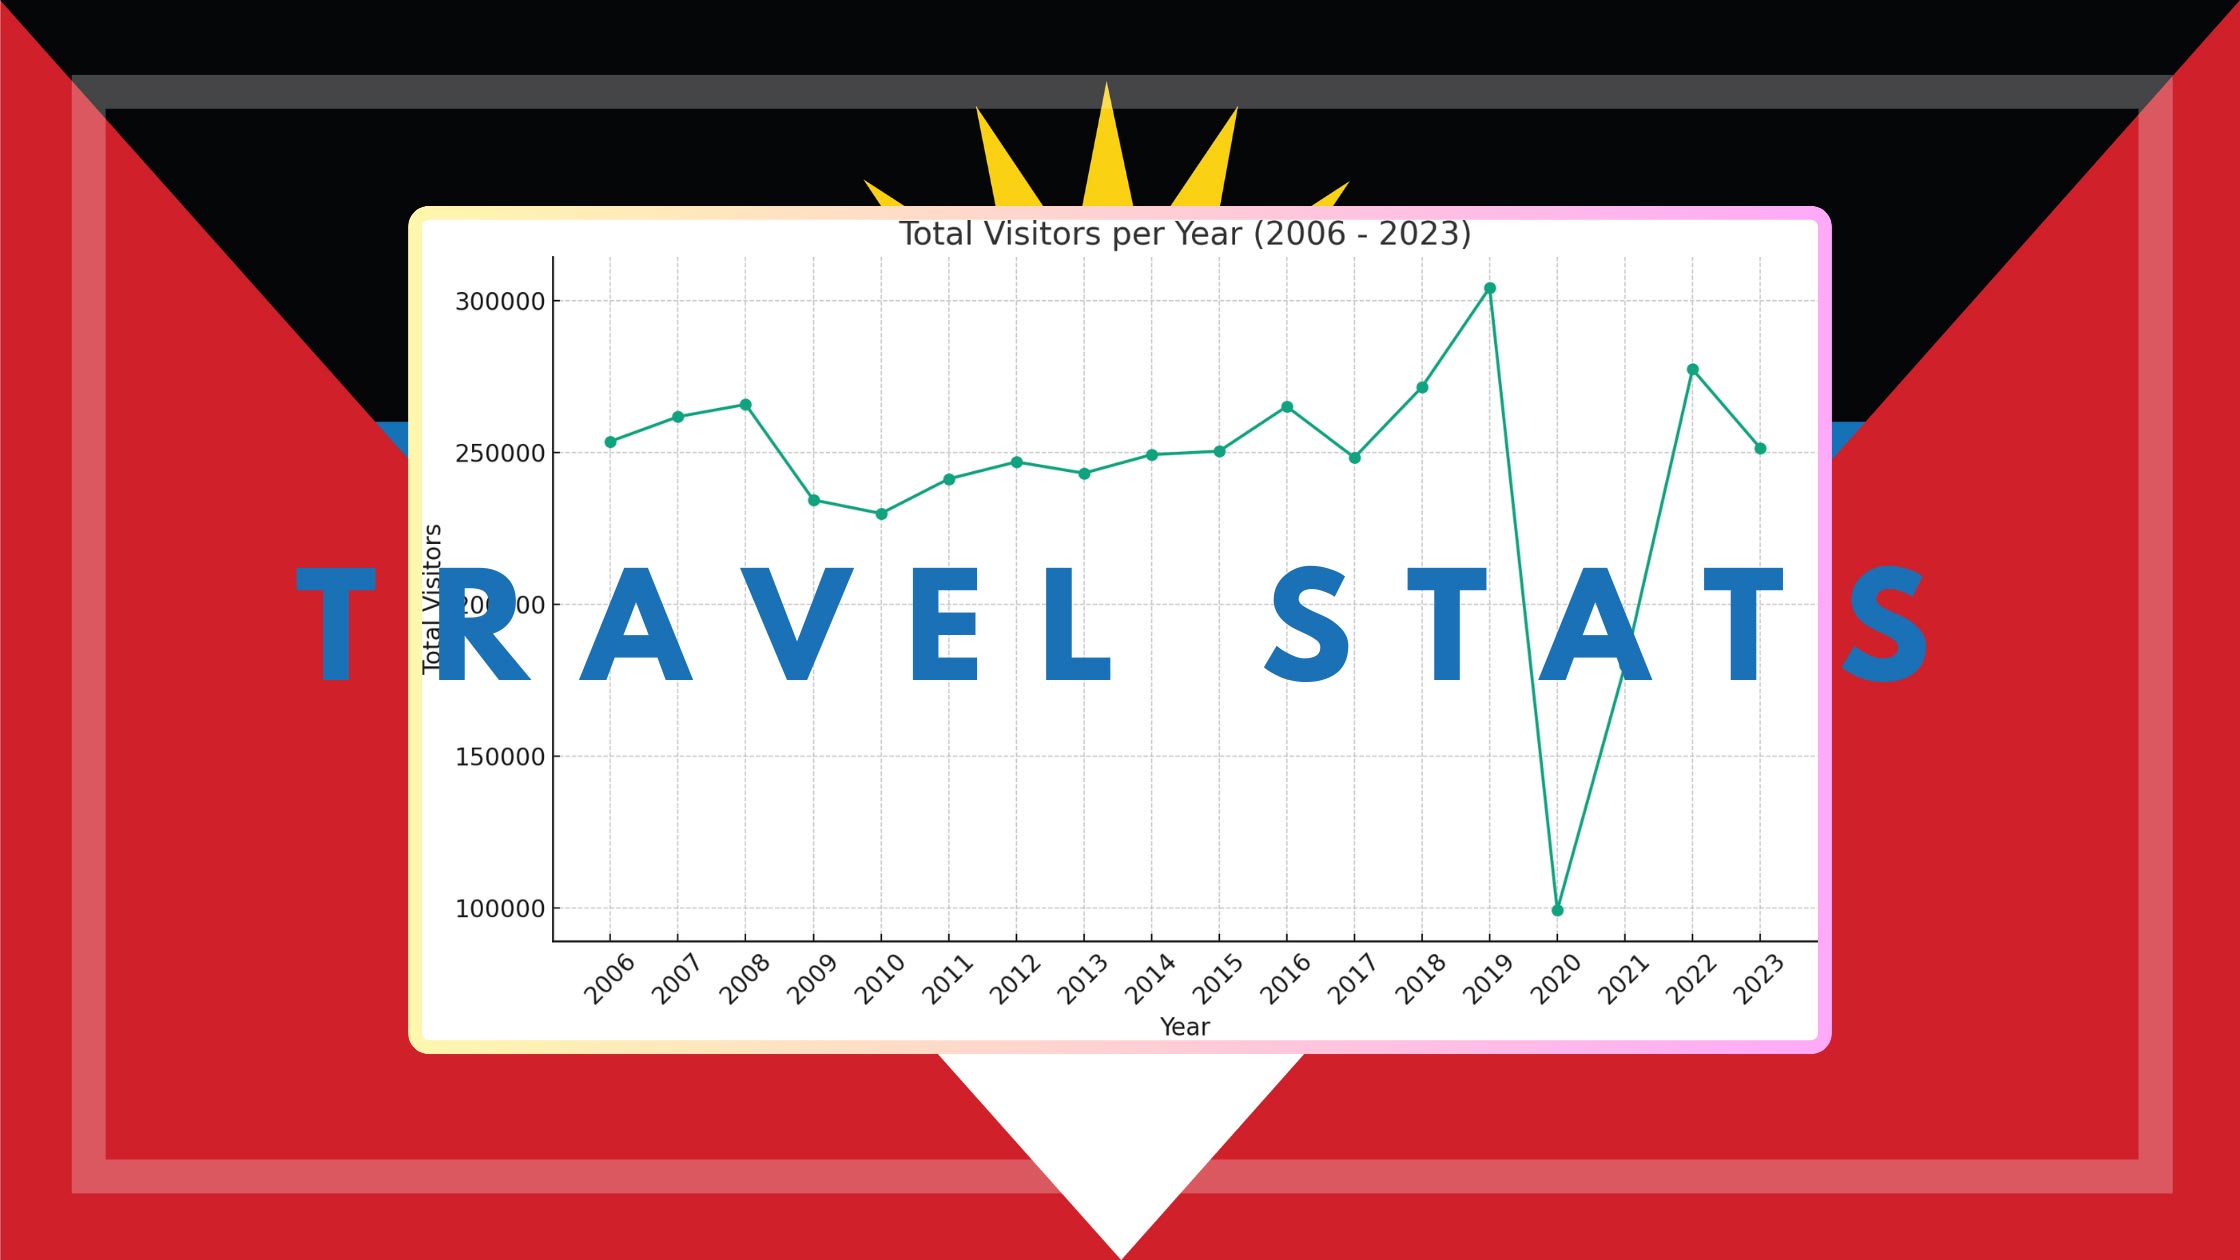
A pandemic hits the world
Covid saw flights grounded almost exclusively worldwide in March 2020 as can be seen here.
USA Visitors to Antigua by year
- Year 2006: 74,627
- Year 2007: 84,609
- Year 2008: 91,982
- Year 2009: 85,192
- Year 2010: 87,302
- Year 2011: 88,644
- Year 2012: 96,936
- Year 2013: 92,201
- Year 2014: 97,897
- Year 2015: 97,964
- Year 2016: 119,997
- Year 2017: 107,354
- Year 2018: 122,453
- Year 2019: 157,082
- Year 2020: 72,432
- Year 2021: 142,270
- Year 2022: 140,062
- Year 2023: 136,721
Uk Visitors to Antigua by Year
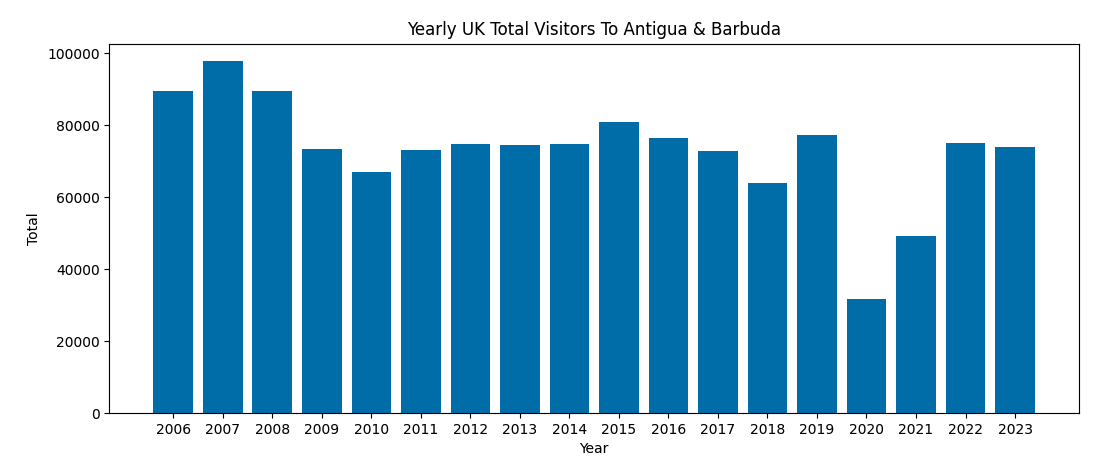
- 2006: 89,524
- 2007: 97,801
- 2008: 89,454
- 2009: 73,351
- 2010: 67,023
- 2011: 73,184
- 2012: 74,717
- 2013: 74,654
- 2014: 74,803
- 2015: 80,911
- 2016: 76,598
- 2017: 72,712
- 2018: 63,986
- 2019: 77,237
- 2020: 31,765
- 2021: 49,128
- 2022: 75,003
- 2023: 73,887
UK Conclusions
June is the weaker monthin terms of UK visitor numbers to Antigua. July is the second weakest as demand increases through to the regular season. Februaray and December make up the UK's strongest months.
Canada Visitors to Antigua by Year
- Year 2006: 13,517
- Year 2007: 11,977
- Year 2008: 14,126
- Year 2009: 14,431
- Year 2010: 15,094
- Year 2011: 15,484
- Year 2012: 20,662
- Year 2013: 24,170
- Year 2014: 31,258
- Year 2015: 33,378
- Year 2016: 37,773
- Year 2017: 38,210
- Year 2018: 45,426
- Year 2019: 43,642
- Year 2020: 42,683
- Year 2021: 46,086
- Year 2022: 53,065
- Year 2023: 53,100
Total European Visitors to Antigua by Year (Includes UK visitors)
- Year 2006: 93,021
- Year 2007: 93,309
- Year 2008: 93,140
- Year 2009: 90,582
- Year 2010: 94,828
- Year 2011: 99,865
- Year 2012: 101,008
- Year 2013: 107,917
- Year 2014: 113,570
- Year 2015: 112,678
- Year 2016: 119,444
- Year 2017: 120,233
- Year 2018: 118,779
- Year 2019: 116,883
- Year 2020: 111,318
- Year 2021: 113,861
- Year 2022: 115,275
- Year 2023: 114,803
Total Europeans excluding UK visitors to Antigua by Year
- Year 2006: 2,233
- Year 2007: 8,207
- Year 2008: 1,624
- Year 2009: 10,681
- Year 2010: 12,899
- Year 2011: 18,378
- Year 2012: 18,275
- Year 2013: 30,038
- Year 2014: 32,022
- Year 2015: 34,789
- Year 2016: 33,338
- Year 2017: 42,072
- Year 2018: 33,533
- Year 2019: 35,493
- Year 2020: 41,178
- Year 2021: 36,818
- Year 2022: 33,211
- Year 2023: 35,508